Power BI Visual Suite
12 custom visuals built for enterprise dashboards. Certified for Microsoft AppSource.
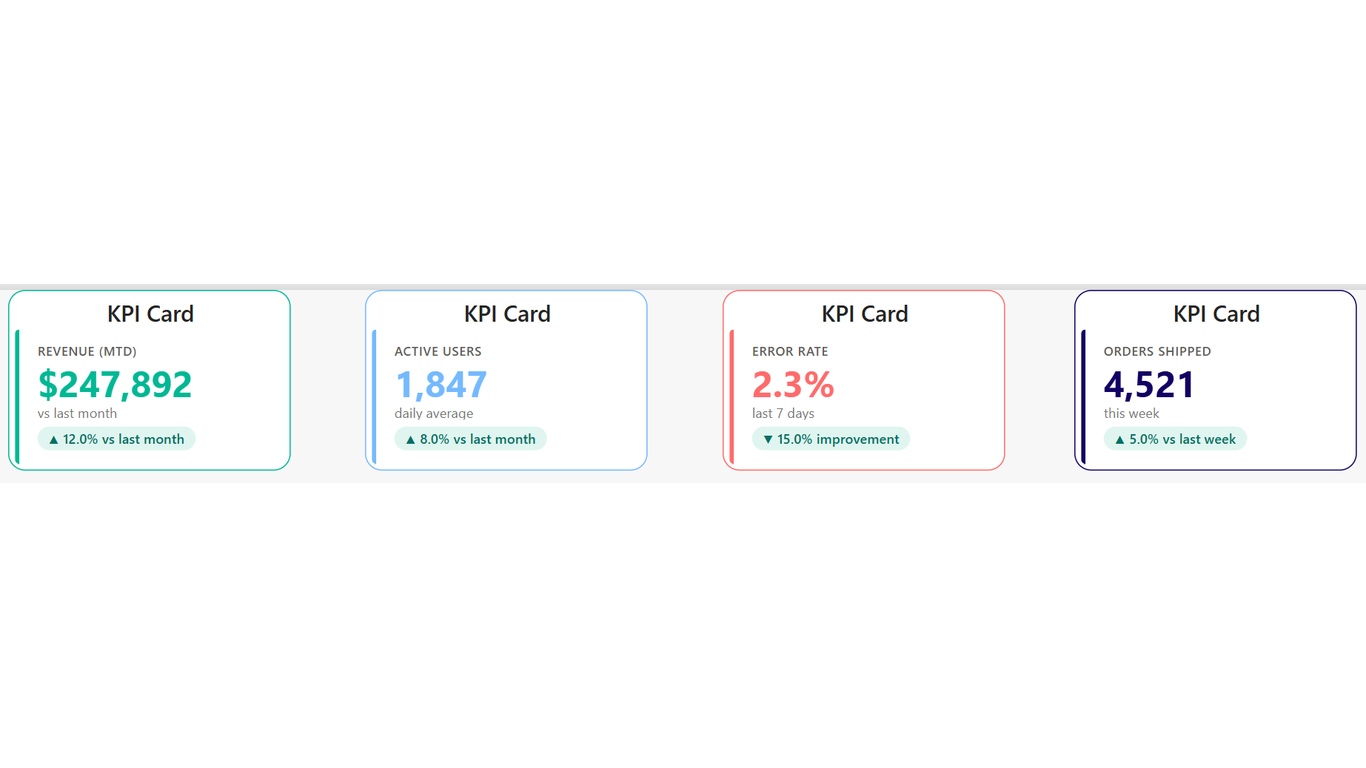
Codex KPI Card
KPIA sleek, branded KPI card with dynamic accent colours and change indicators.
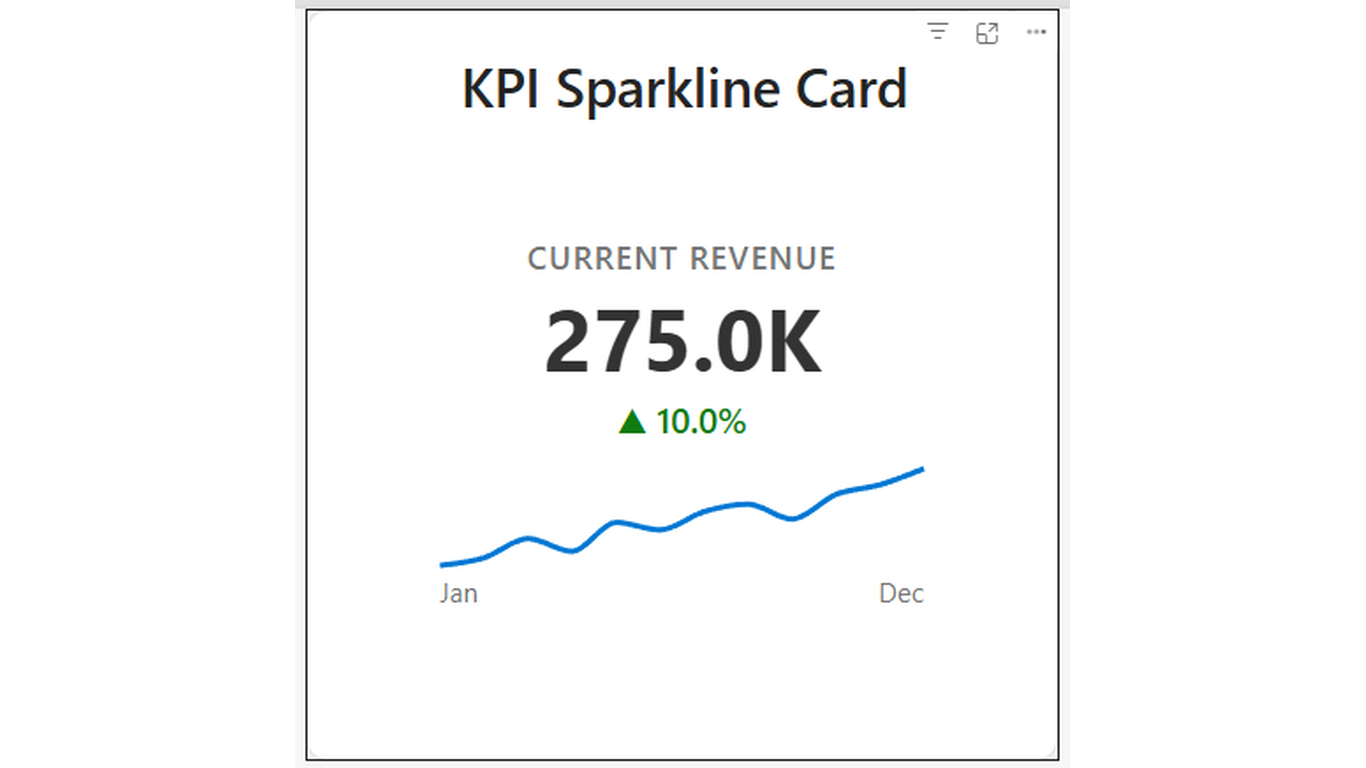
Codex KPI Sparkline Card
KPIA KPI card with an embedded sparkline trend — value, target, and trend in one tile.
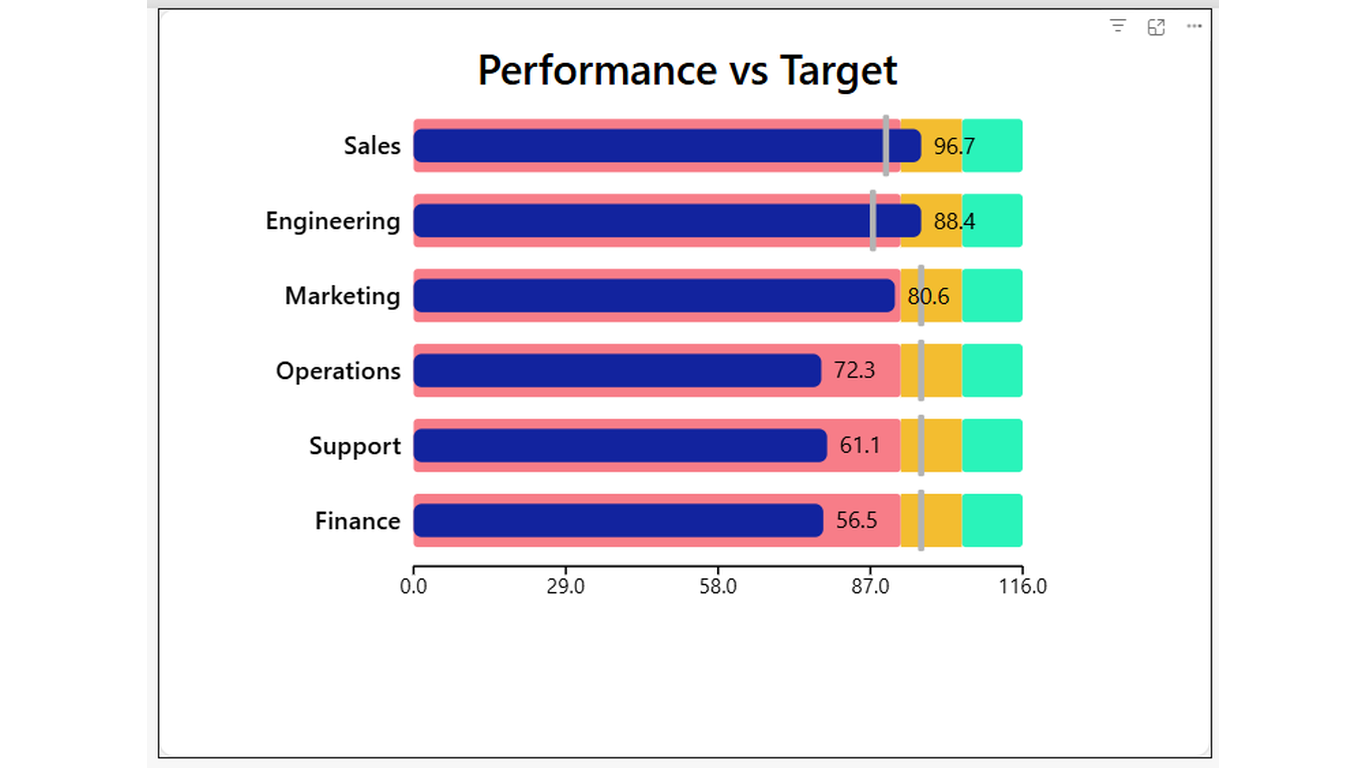
Codex Bullet Chart
ChartCompare actual performance against a target — in less space than a bar chart.
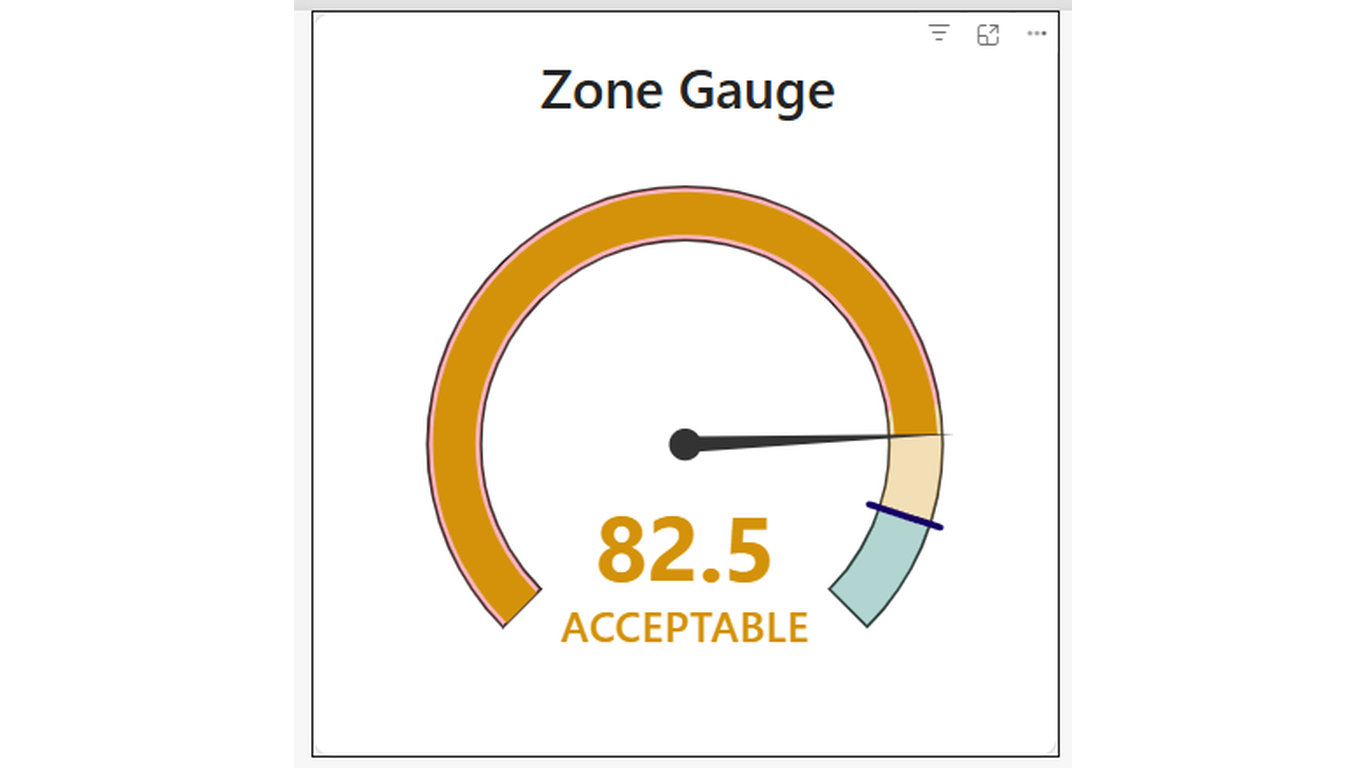
Codex Zone Gauge
KPIA semicircular gauge with configurable danger, warning, and success zones.
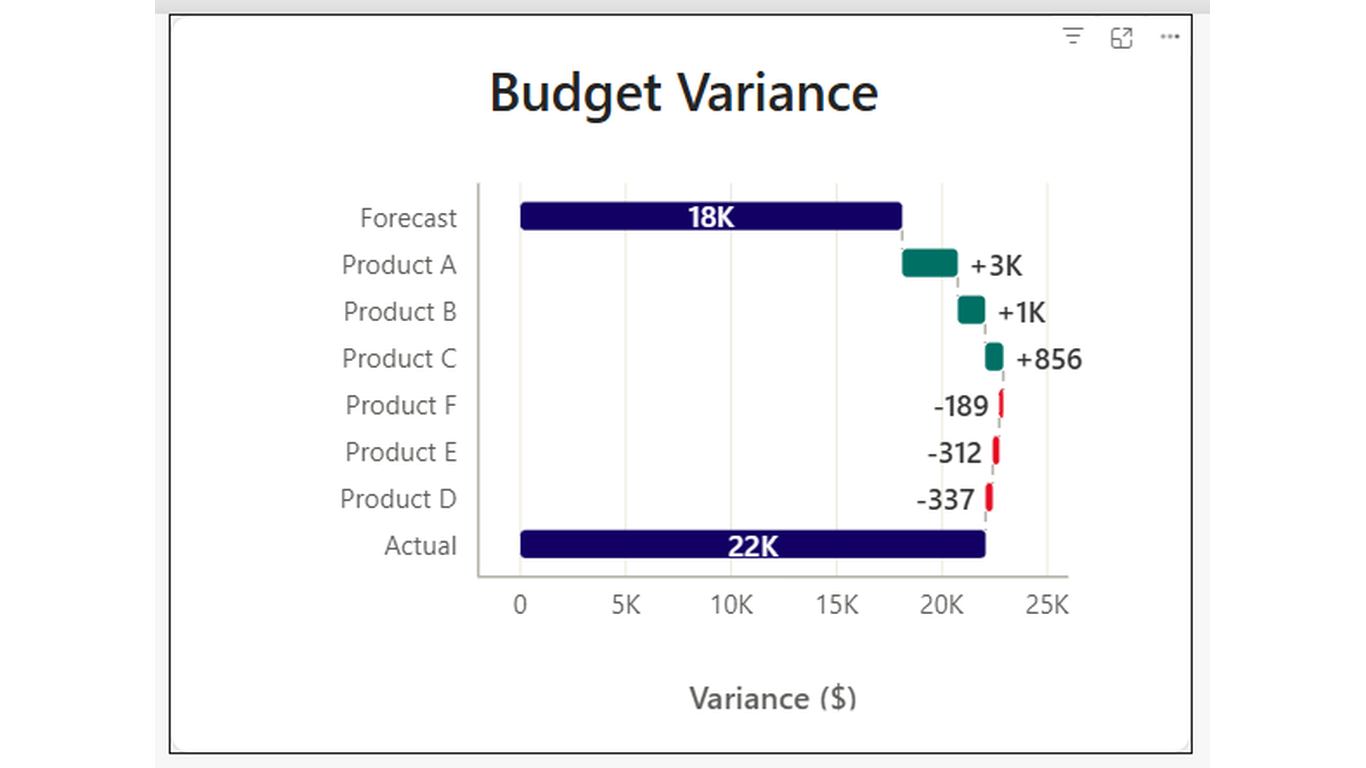
Codex Variance Waterfall
ChartShow how individual drivers bridge from a starting value to an end result.
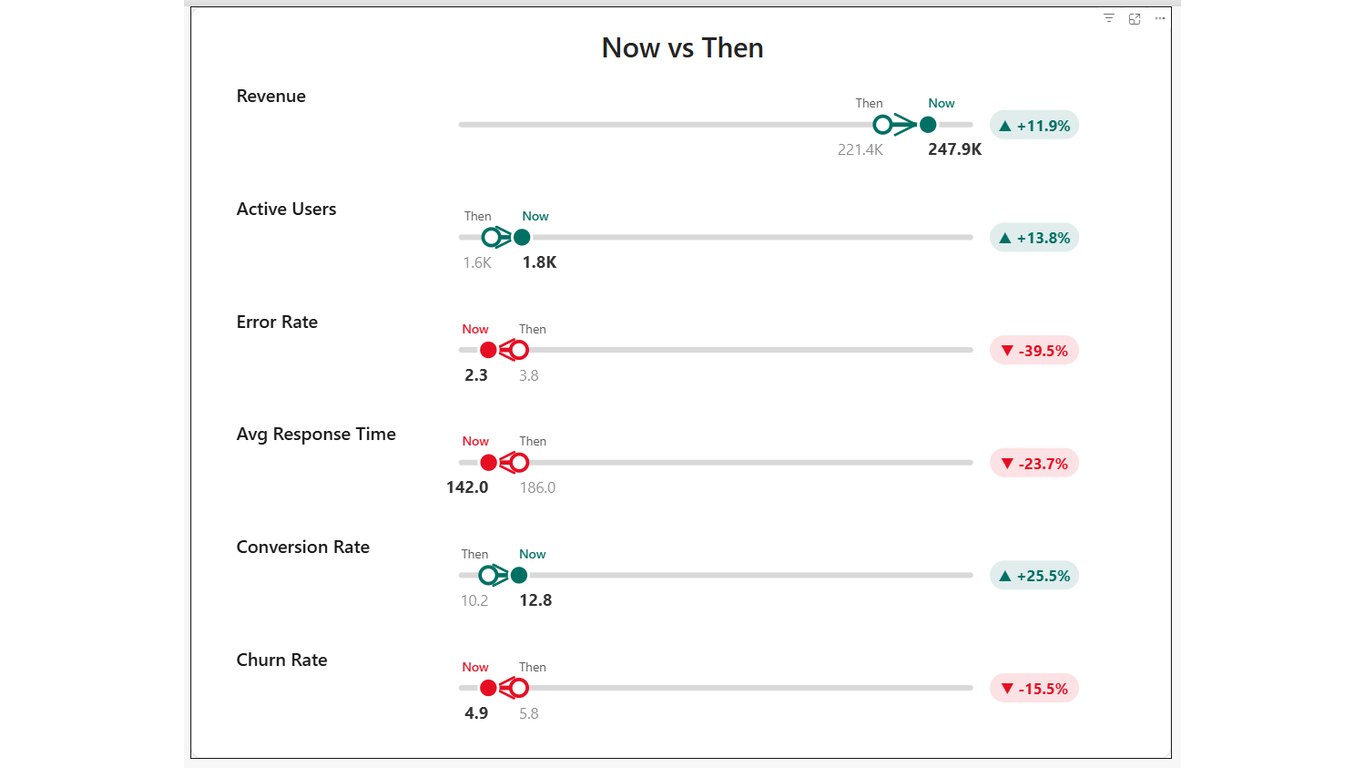
Codex Now vs Then
ChartAn animated dumbbell chart — compare current vs baseline with variance badges.
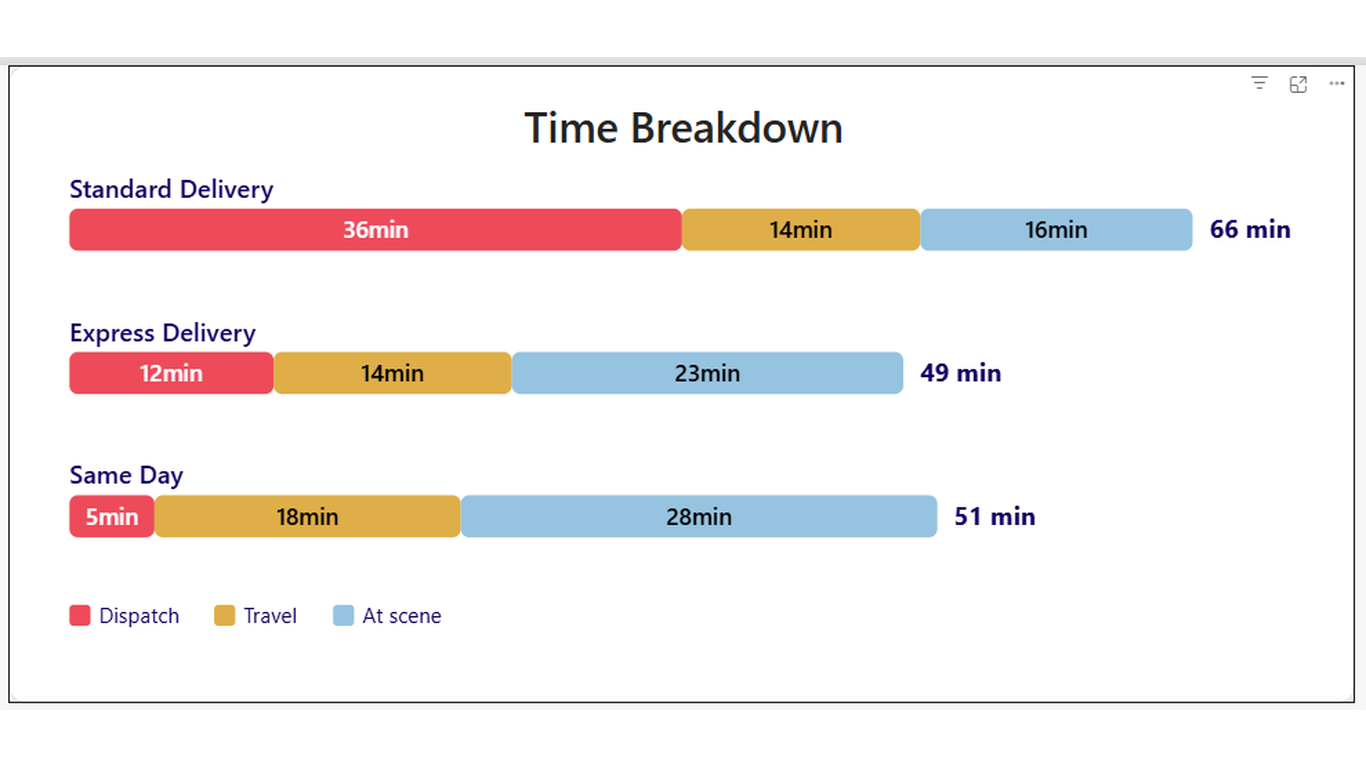
Codex Time Breakdown
ChartBreak total time into labelled segments — and compare across scenarios.
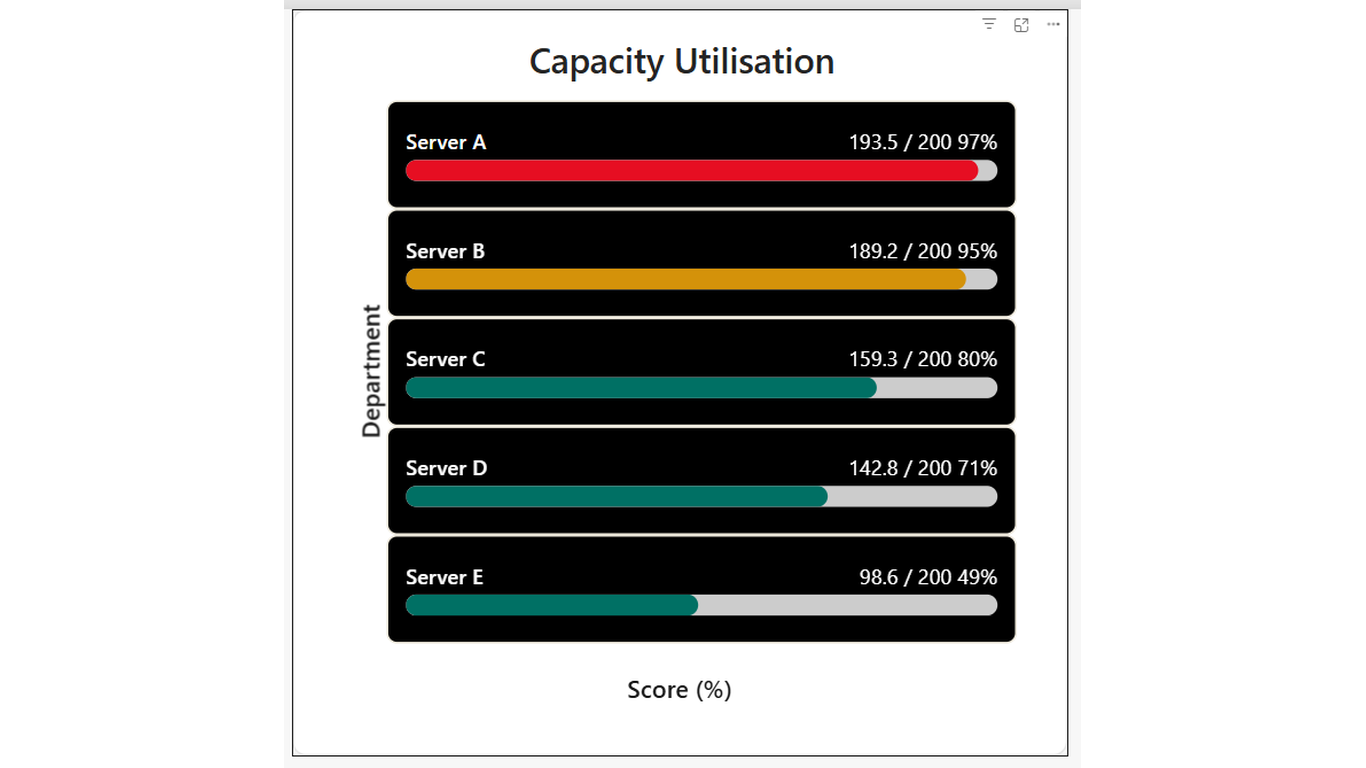
Codex Progress Bar Card
KPIMulti-row progress bars with automatic colour thresholds — green, amber, red.
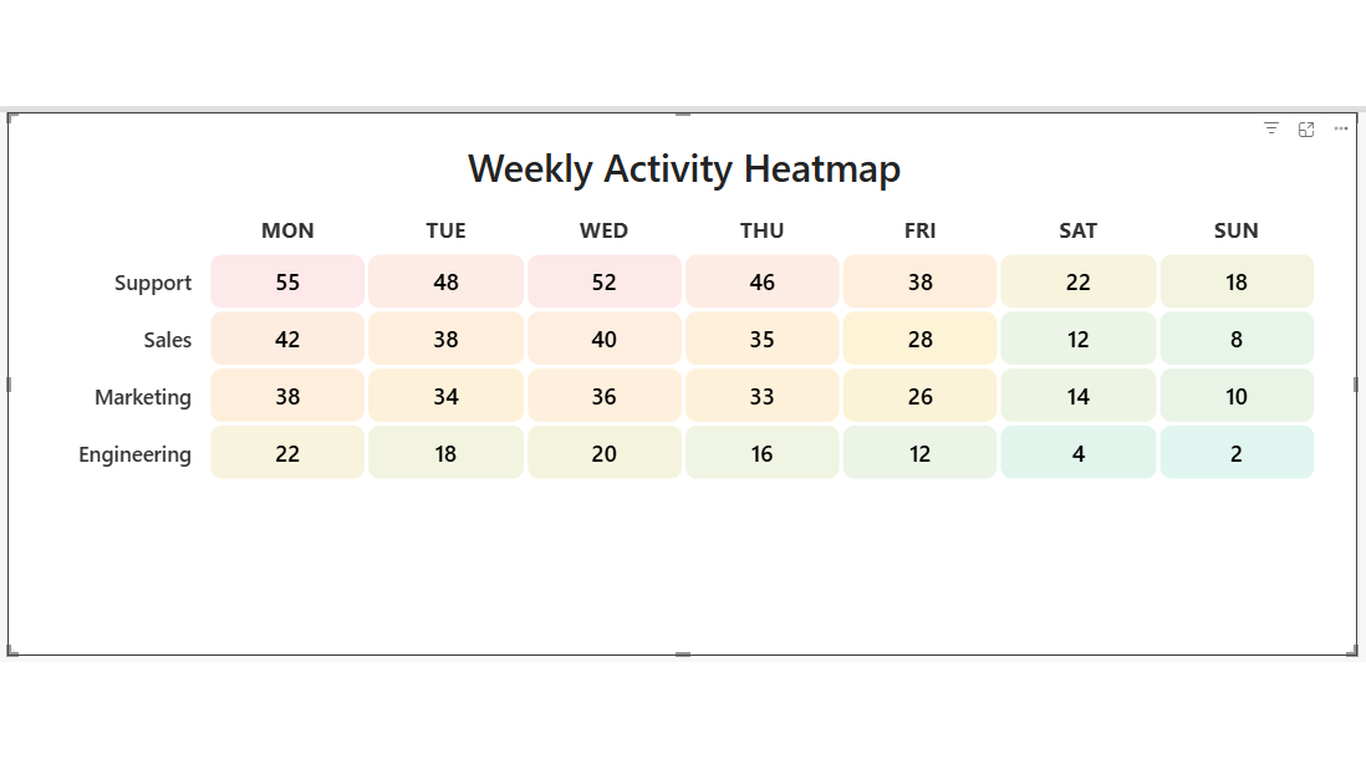
Codex Heatmap Matrix
TableSpot patterns, hotspots, and outliers across a grid — at a glance.
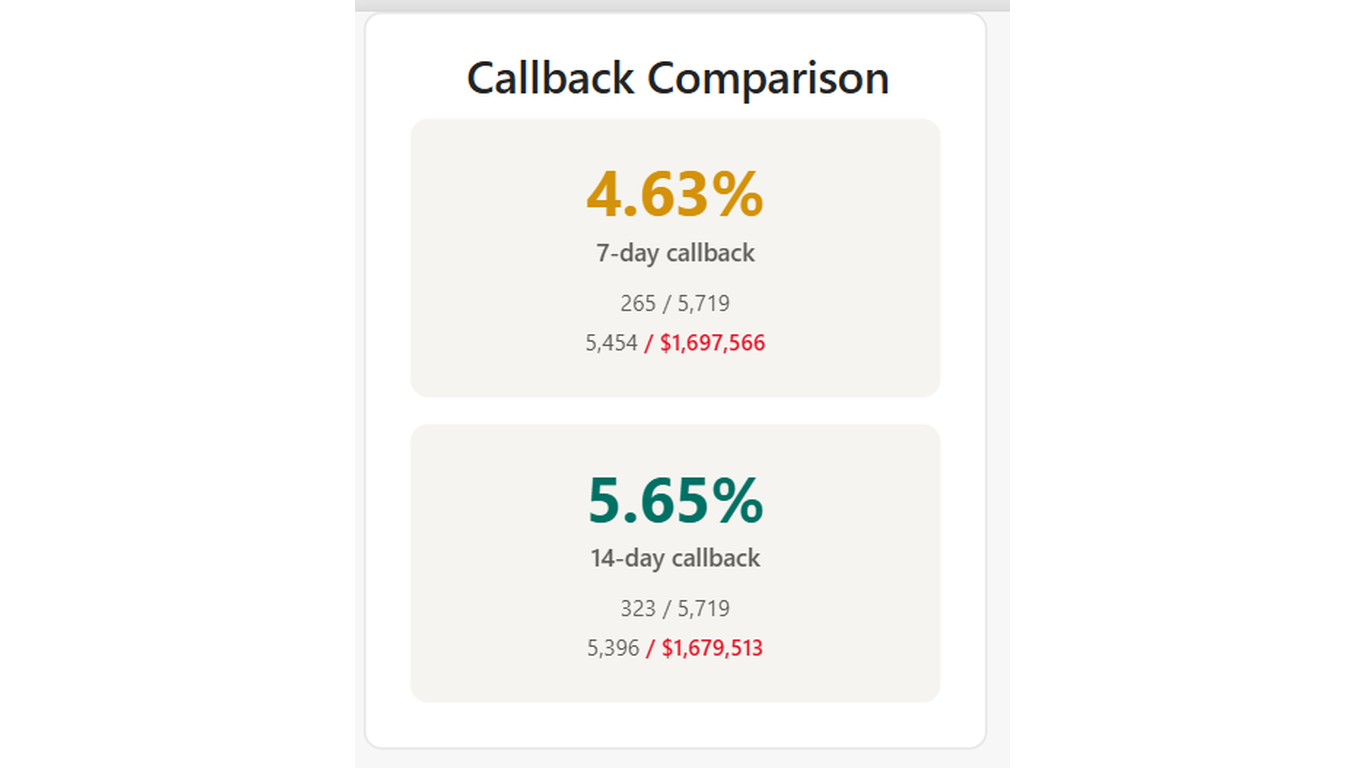
Codex Callback Card
KPISide-by-side comparison cards for return rate and revenue impact analysis.
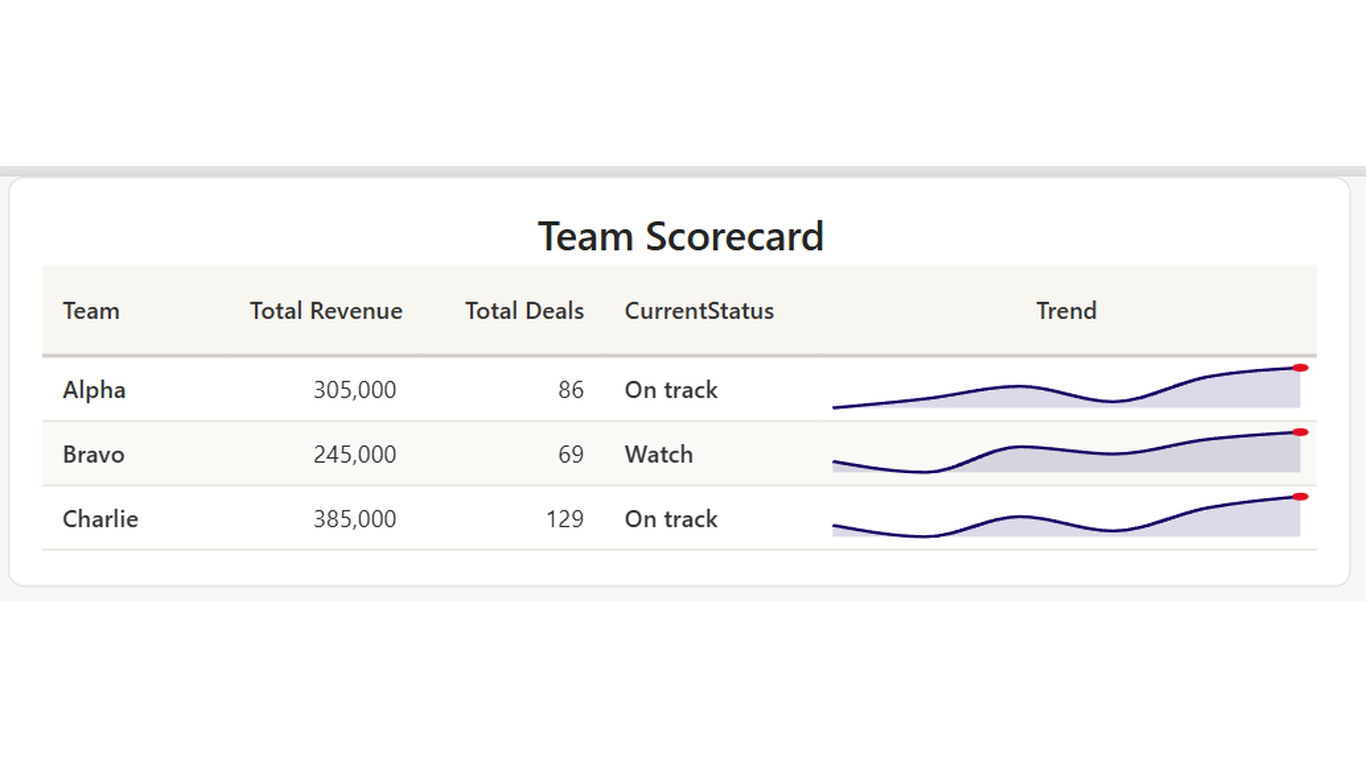
Codex Sparkline Table
TableA scorecard table with inline sparklines — trend and value in every row.
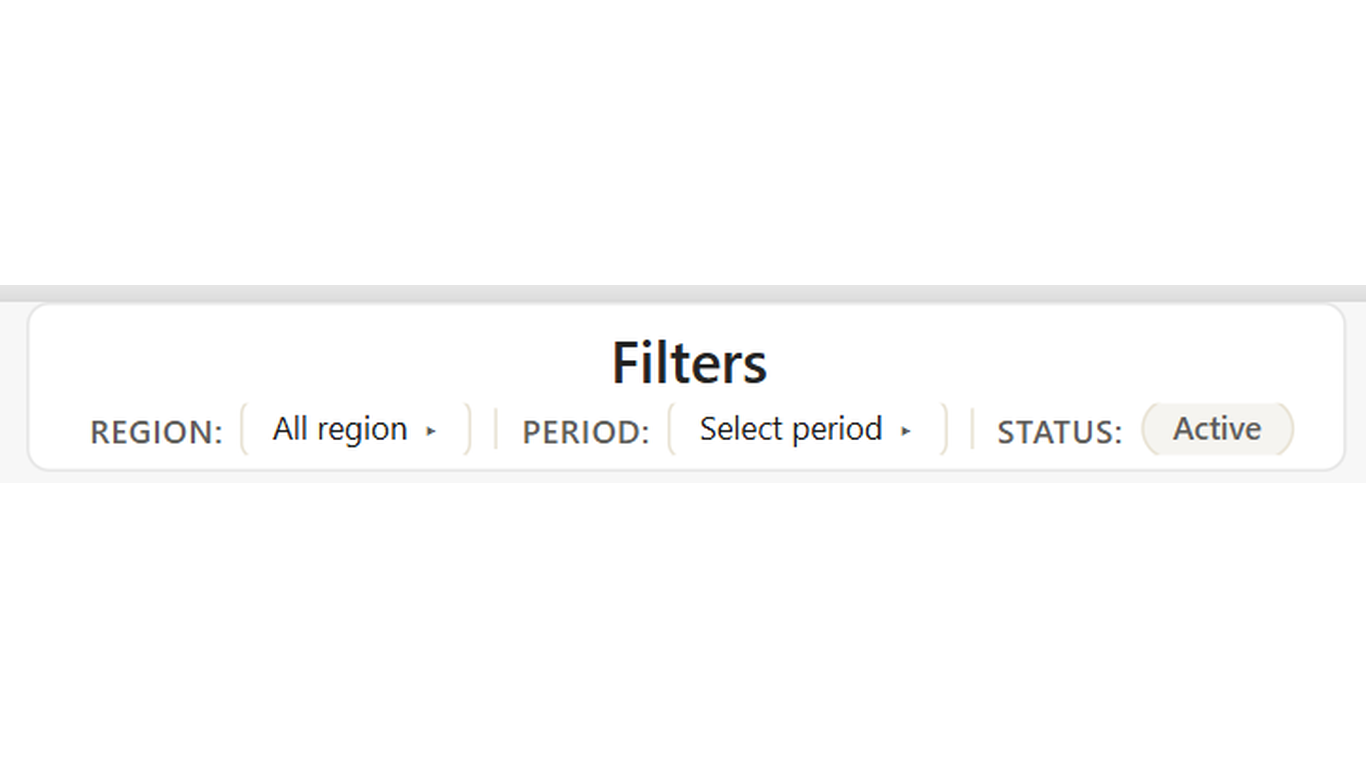
Codex Slicer Bar
FilterReplace multiple slicer visuals with one compact, horizontal filter bar.
Level up your dashboards.
Each visual is available individually on Microsoft AppSource.
Browse the Suite ↑