Codex Variance Waterfall
ChartShow how individual drivers bridge from a starting value to an end result.
Overview
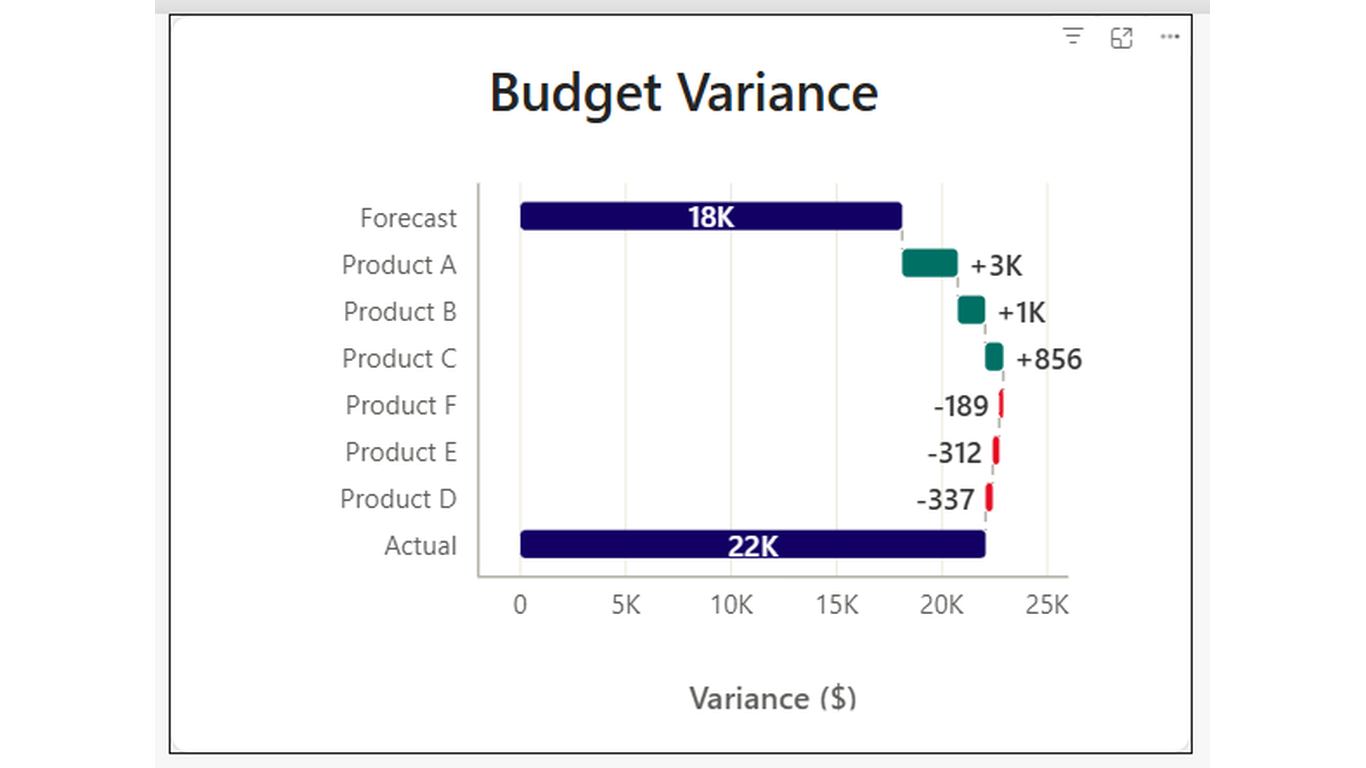
Bridge the gap between forecast and actual. Codex Variance Waterfall is a bridge chart that starts from a baseline total, steps through individual variances — positive and negative — and lands on the final result. It answers the question 'what drove the difference?' in a single, self-explanatory visual.
Ideal For
- Budget vs actual — what drove the variance by cost centre or product
- Revenue bridge — price, volume, and mix effects month-over-month
- Headcount or inventory movements — openings, closings, and net change
- Any scenario where you need to explain how you got from A to B
Key Features
- Automatic running total calculation — no pre-calculated cumulative columns needed
- Positive bars (green) and negative bars (red) with configurable colours
- Distinct start and end total bars styled differently from step bars
- Connector lines between bars for readability
- Sort by absolute variance, category name, or natural order
- Value labels on all bars with configurable format
- Hover tooltip showing step label, step value, and running total
- Click a bar to cross-filter other visuals on the page
Pro Tip
Use ALLSELECTED in your Start Value measure so the opening bar always shows the full forecast total regardless of which categories are filtered.
$1.99
/ user / month
Billed through Microsoft AppSource
Category
Chart
Tooltips
Cross-filtering
High Contrast