Codex Heatmap Matrix
TableSpot patterns, hotspots, and outliers across a grid — at a glance.
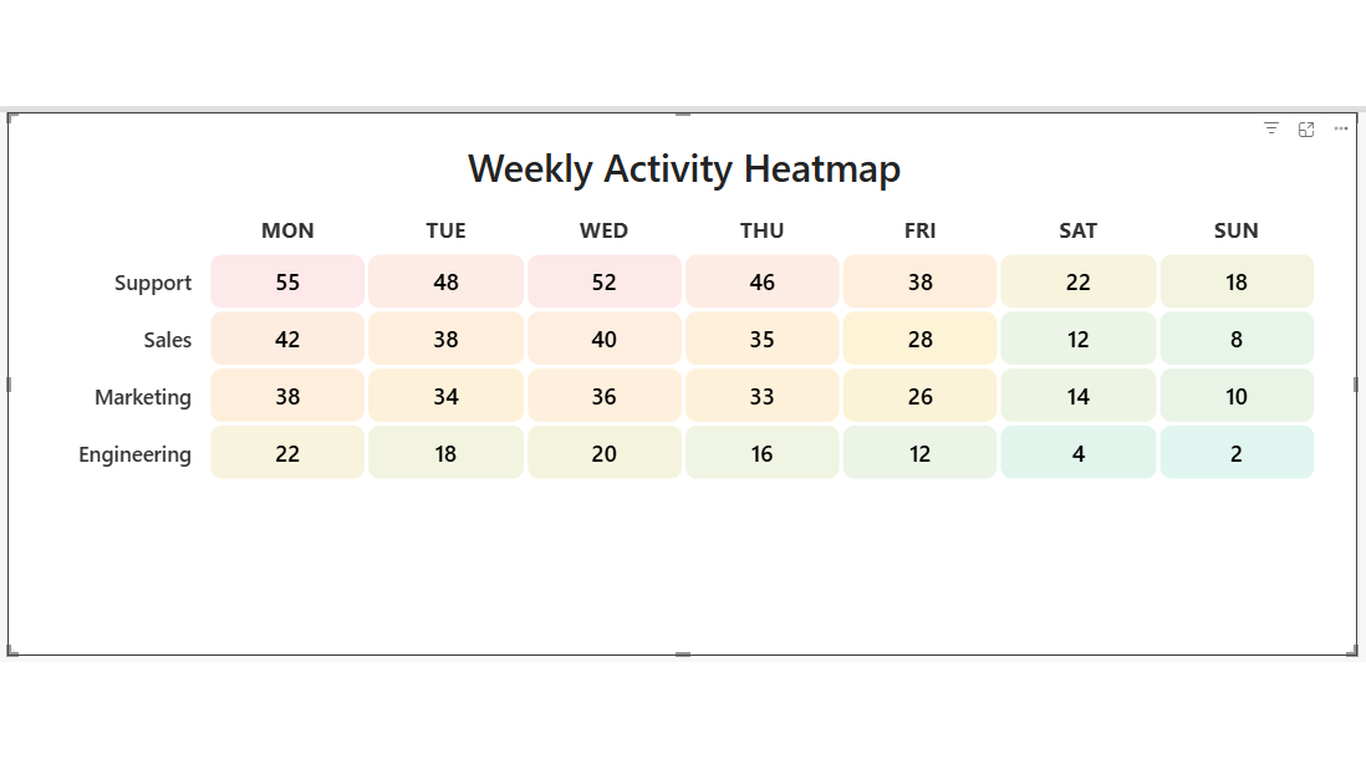
Overview
Patterns hide in tables. Heatmaps reveal them instantly. Codex Heatmap Matrix renders a two-dimensional grid where cell colour encodes the value — making hotspots, clusters, and outliers immediately visible. It's the fastest way to identify patterns across a row-by-column matrix.
Ideal For
- Activity patterns — tickets, orders, or events by day of week and hour
- Performance matrices — score by team and month, or accuracy by product and region
- Resource utilisation — occupancy or load by resource and time period
- Any two-dimensional cross-tab where relative magnitude matters
Key Features
- Full colour gradient across all cells from the minimum to maximum value
- Built-in colour schemes: green-to-red, red-to-green, or fully custom
- Custom low, mid, and high colours for brand-aligned palettes
- Null/zero cell colour configurable separately
- Cell value labels with configurable number format
- Corner rounding for a polished, card-like cell appearance
- Hover tooltip showing row, column, and cell value
- Click a cell to cross-filter other visuals on the page
Pro Tip
Use the Sort order field well on the Column Category to enforce a logical order (e.g. Mon=1 through Sun=7). Without it, Power BI will sort day names alphabetically.
$1.99
/ user / month
Billed through Microsoft AppSource
Category
Table
Tooltips
Cross-filtering
High Contrast