Codex Time Breakdown
ChartBreak total time into labelled segments — and compare across scenarios.
Overview
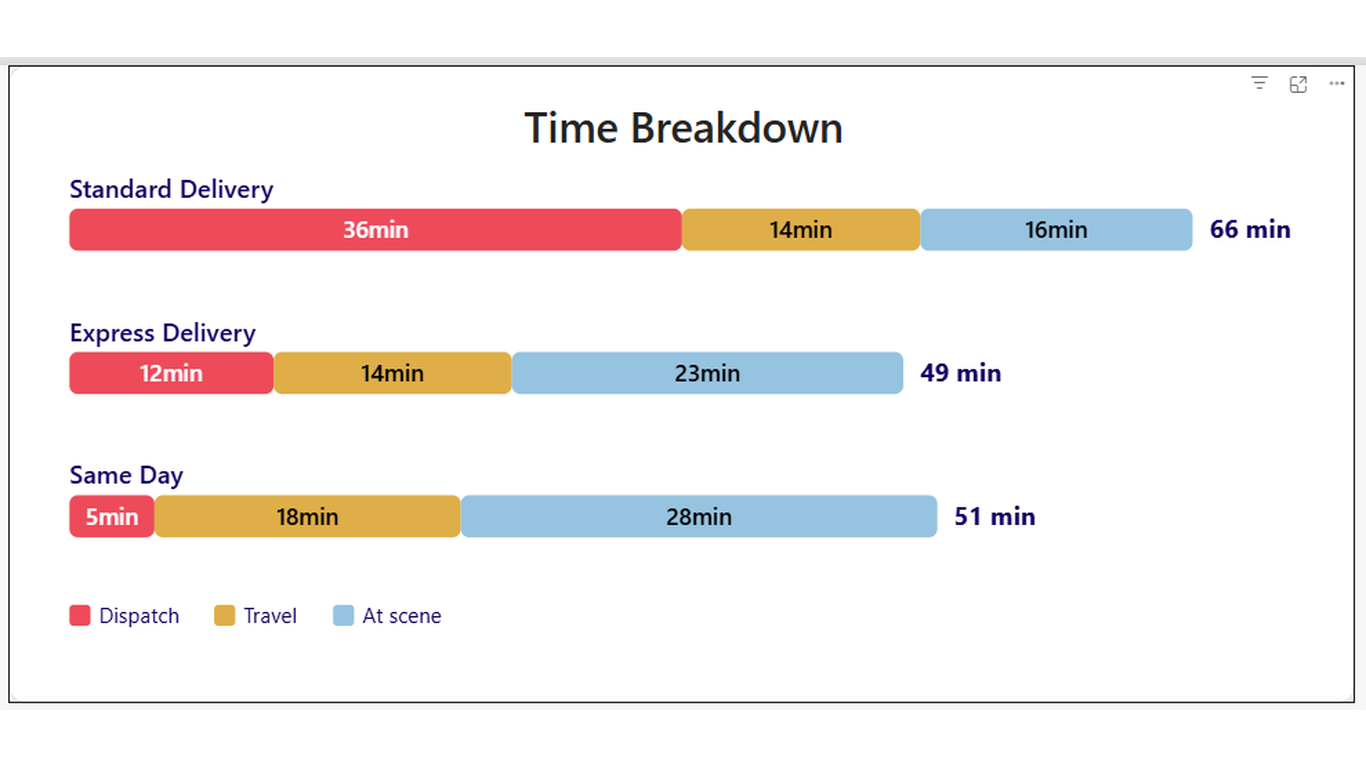
Where does the time go? Now you can show it. Codex Time Breakdown renders each category as a horizontal stacked bar split into up to three named segments. It's built for time analysis — showing how a total duration breaks down into stages — but works for any additive measure you want to decompose.
Ideal For
- Event or process time analysis — dispatch, travel, and on-site durations
- Project phase breakdown — design, build, and test time by team
- Customer journey timing — wait, service, and resolution stages
- Budget decomposition — labour, materials, and overhead by project
Key Features
- Up to three named segments per bar with independent colours and labels
- Show/hide segment labels and values independently via Format pane toggles
- Total value displayed as an end label on each bar
- Sort order field well — control row order with any measure
- Configurable value unit suffix (e.g. 'min', 'hrs', '$')
- Legend with segment names and colours
- Hover tooltip showing category, each segment value, and total
- Click a bar to cross-filter other visuals on the page
Pro Tip
Use the Sort order field well to arrange scenarios by total duration (longest first) rather than alphabetically. This immediately draws attention to the worst-case scenario.
$1.99
/ user / month
Billed through Microsoft AppSource
Category
Chart
Tooltips
Cross-filtering
High Contrast