Codex Sparkline Table
TableA scorecard table with inline sparklines — trend and value in every row.
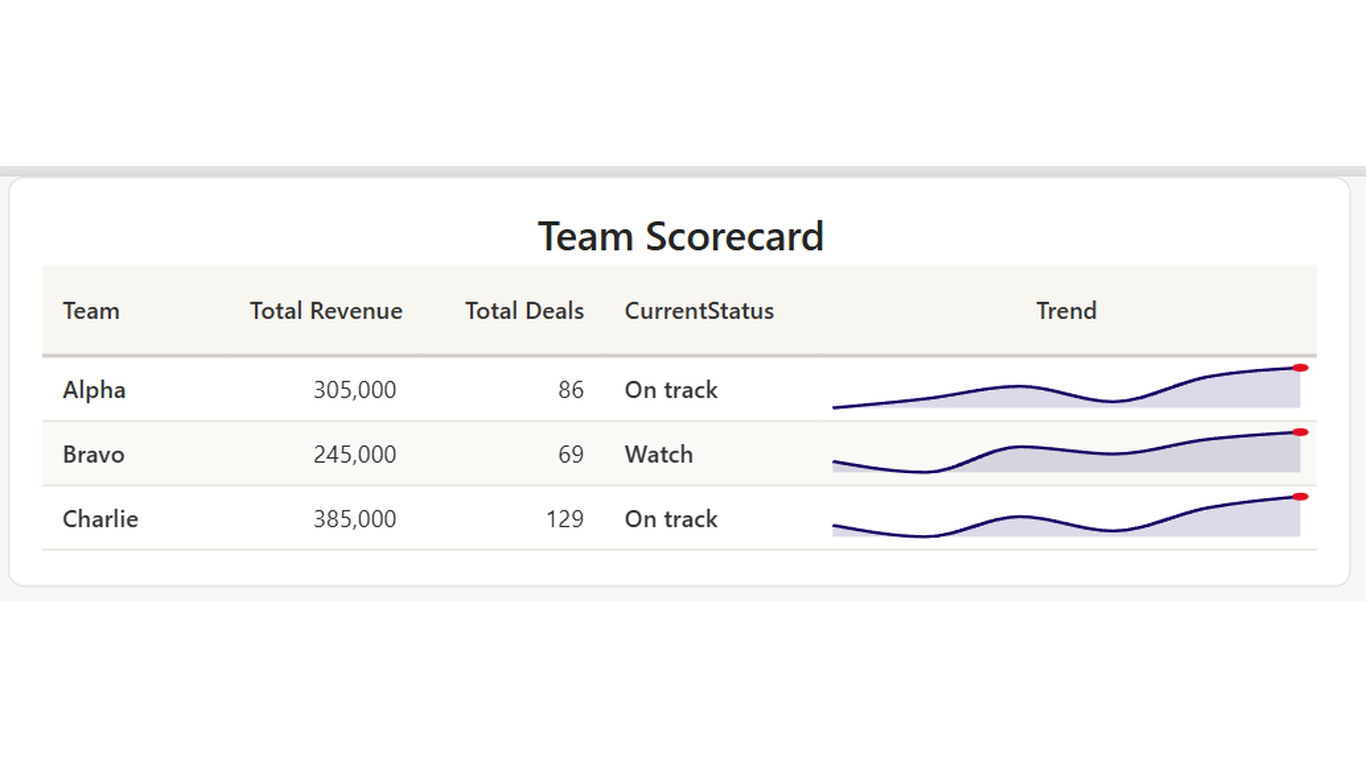
Overview
A table that shows the trend, not just the number. Codex Sparkline Table is a multi-column scorecard where each measure column includes an inline sparkline showing the trend over time. You get the current value and the historical pattern in a single row.
Ideal For
- Team or department scorecards — revenue, deals, satisfaction, and trend per row
- Product performance tables — multiple KPIs with monthly trend built in
- Regional comparison — key metrics with trend context for each region
- Any table where 'is this getting better or worse?' matters as much as the current value
Key Features
- One sparkline per measure column — trend rendered inline with the value
- Multiple measures supported — each gets its own column with its own sparkline
- Text columns for status badges or categorical values per row
- Sparkline colour, line width, and area fill configurable per measure
- Sparkline Category for the trend axis — wire to your date or period dimension
- Column widths auto-adjust — table is scrollable for many rows or columns
- Hover tooltip showing row category and all measure values
- Click a row to cross-filter other visuals on the page
Pro Tip
Sort the Sparkline Category by a numeric order measure (e.g. MonthOrder) to ensure the trend renders chronologically.
$1.99
/ user / month
Billed through Microsoft AppSource
Category
Table
Tooltips
Cross-filtering
High Contrast